


?")


Executive Summary
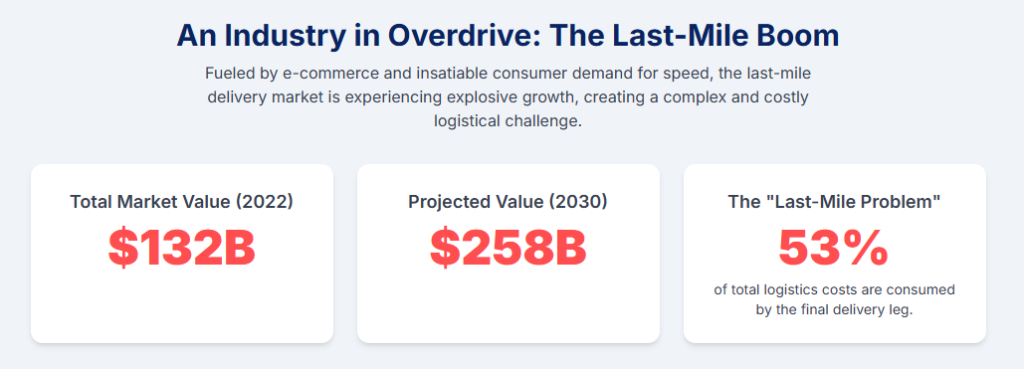
The global last-mile delivery market is undergoing a profound transformation, driven by the relentless expansion of e-commerce, rapid urbanization, and heightened consumer expectations for speed and convenience. This report provides an exhaustive analysis of this evolving landscape, with a particular focus on the escalating role of motorcycles as the dominant vehicle for urban logistics. The market is valued at over 132 billion in 2022 and is projected to reach over 258 billion by 2030, with certain segments experiencing explosive double-digit growth. While traditional delivery vehicles like vans face increasing inefficiencies in congested urban environments, motorcycles and scooters are uniquely positioned to address the fundamental challenges of cost, speed, and maneuverability.
The analysis reveals that the last-mile segment, which accounts for a significant portion of total logistics costs, is being reimagined through a multimodal vehicle strategy, where each vehicle type serves a specialized role. Furthermore, the report delves into the critical transition to electric vehicles (EVs), highlighting the innovative business models—such as India’s widespread battery-swapping networks—that are overcoming traditional adoption barriers like high upfront costs and long charging times.
However, this growth is not without its complexities. The report sheds light on the socio-economic realities of the gig economy model, which provides flexibility but often at the cost of income stability, safety, and worker protections. A detailed case study on India, with a specific focus on the city of Pune, illustrates how macroeconomic trends and technological innovations are playing out in a real-world, high-growth environment. The report concludes with strategic recommendations for businesses and policymakers, emphasizing the need for a holistic approach that integrates advanced technology, equitable labor practices, and forward-thinking urban policy to build a sustainable and resilient last-mile delivery ecosystem.
1. The Global Last-Mile Delivery Market: A High-Growth Epicenter of E-commerce
1.1. Market Valuation and Growth Trajectory: Quantifying the Last-Mile Boom
The global last-mile delivery market is a colossal and rapidly expanding sector, with its value estimated at USD 132.71 billion in 2022 and a projected rise to USD 258.68 billion by 2030, reflecting a robust Compound Annual Growth Rate (CAGR) of 8.8% from 2023 to 2030.1 This expansion is a global phenomenon, though it is particularly pronounced in certain regions. North America led the market in 2022 with more than 31% of the share, a dominance driven by consumer expectations and technological maturity.1 However, the Asia Pacific region is identified as the fastest-growing market, propelled by factors such as a rising middle-class population, increased smartphone penetration, and expanding internet connectivity.1 The market’s dynamism is further underscored by the fact that the e-commerce last-mile segment alone is projected to grow from an estimated 150 billion in 2025 to 500 billion by 2033, demonstrating a powerful CAGR of 15%.2
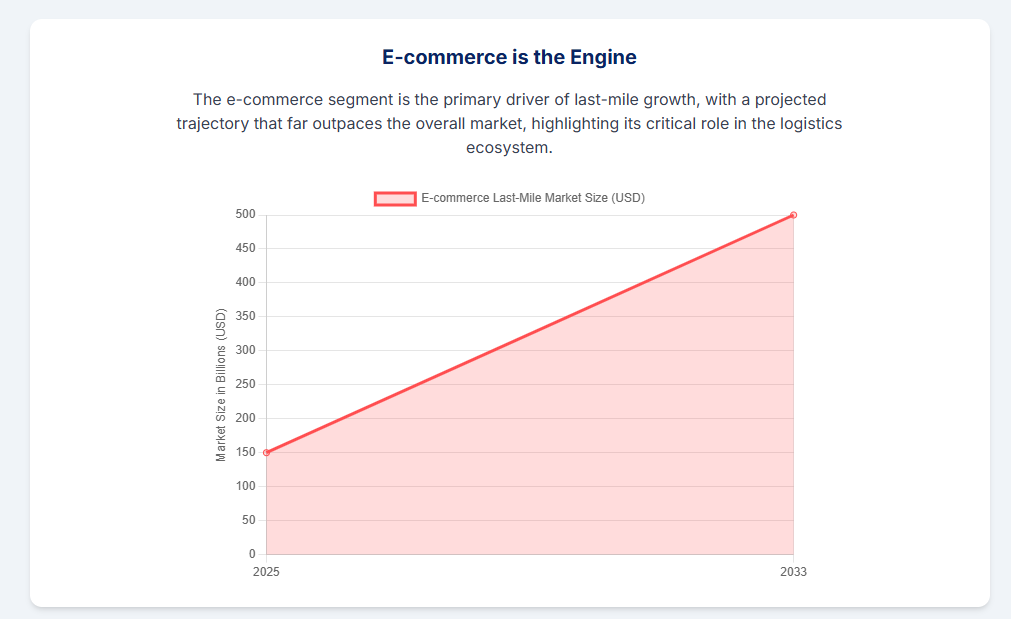
The various growth forecasts for this market—ranging from a global CAGR of 8.8% for the overall last-mile market 1 to a 15% CAGR for the e-commerce segment 2—are not a contradiction but a reflection of the market’s complexity and the diverse methodologies of different research firms. These figures highlight the fragmented and multifaceted nature of the industry. The underlying trend is universally strong growth, regardless of the precise numbers. A higher CAGR for the e-commerce segment compared to the overall market suggests that e-commerce is the primary engine of last-mile growth. This nuance is critical for strategic planning and investment, underscoring the need for a granular, segment-by-segment analysis rather than a single, sweeping market projection. The following table provides a composite, nuanced view of the market’s value and growth trajectory by synthesizing these varied data points.
| Report Attribute | Grand View Research 1 | Data Insights Market 2 | Dropoff 3 |
| Market Segment | Global Last-Mile Delivery | E-commerce Last-Mile Delivery | Last-Mile Delivery |
| 2022 Market Size | USD 132.71 billion | N/A | N/A |
| 2025 Market Size (Projected) | N/A | USD 150 billion | N/A |
| 2028 Revenue Forecast | N/A | N/A | USD 60.82 billion (approximate expansion) |
| 2030 Revenue Forecast | USD 258.68 billion | N/A | N/A |
| 2033 Revenue Forecast | N/A | USD 500 billion | N/A |
| CAGR | 8.8% (2023-2030) | 15% (2025-2033) | 5.12% (2023-2028) |
| Base Year for Estimation | 2022 | N/A | N/A |
1.2. Foundational Drivers: E-commerce, Urbanization, and Consumer Expectations
The market’s expansion is not accidental; it is a direct consequence of powerful macroeconomic and behavioral shifts. A key driver is the explosive growth in e-commerce, which was significantly accelerated by the COVID-19 pandemic as lockdowns and restrictions prompted a surge in online shopping and home deliveries.1 This is further fueled by the burgeoning online retail sector and the escalating consumer demand for faster, more convenient delivery options.2 The proliferation of online shopping is a global trend, but its impact is intensified in regions like Asia Pacific due to increasing smartphone and internet penetration.1
Urbanization plays a dual role as both a driver and a challenge. With more people living in densely populated cities, the demand for efficient delivery networks increases. However, urbanization simultaneously creates logistical hurdles like traffic congestion and limited parking.4 These factors have made traditional delivery vehicles less efficient, creating a perfect environment for agile alternatives. This dynamic has compelled logistics providers to adapt their strategies to meet the evolving needs of modern urban populations.
Consumer expectations have evolved dramatically, shifting from a preference for fast delivery to a demand for it as a standard. The desire for same-day or next-day delivery is no longer a luxury but an assumed requirement.1 This “hyper-personalization of deliveries” and the need for real-time tracking have placed immense pressure on logistics providers to optimize their operations and provide a seamless, transparent customer experience.3
1.3. Navigating the Last-Mile “Problem”: Cost, Congestion, and the Pursuit of Efficiency
The last-mile segment, while critical, is notoriously inefficient and expensive. It can account for a staggering 53% of total logistics expenses, according to some estimates, earning it the moniker of the “last-mile problem”.8 The high costs are attributed to numerous factors, including the navigational challenges of dense urban areas, the surge in e-commerce leading to more small-scale deliveries, the cost of maintaining a skilled delivery workforce, and rising fuel and vehicle maintenance prices.10
Traffic congestion is a primary logistical nightmare. What might be a 10-minute drive in an ideal scenario can turn into a 30-minute ordeal in urban gridlock, leading to delays and increased operational costs.9 These challenges are compounded by a lack of driver availability and external factors such as failed deliveries and parcel theft.9 The collective aim for last-mile delivery providers is to address this “problem” through strategic improvements, including route optimization, leveraging technology, improving visibility, and enhancing sustainability.8 This drives the search for innovative vehicle types and operational models that can navigate these complex, high-friction environments.
2. The Motorcycle’s Strategic Role: Agility as a Competitive Advantage
2.1. Why Two-Wheelers Dominate: Operational Efficiency in Densely Populated Areas
The motorcycle and scooter segment is not just a part of the last-mile market; it is the fundamental “backbone of urban last-mile logistics”.6 The market for last-mile delivery motorcycles is a multi-billion dollar sector, with its value projected to reach over US
86billionby2031fromUS52 billion in 2024, representing a CAGR of approximately 7.5%.6
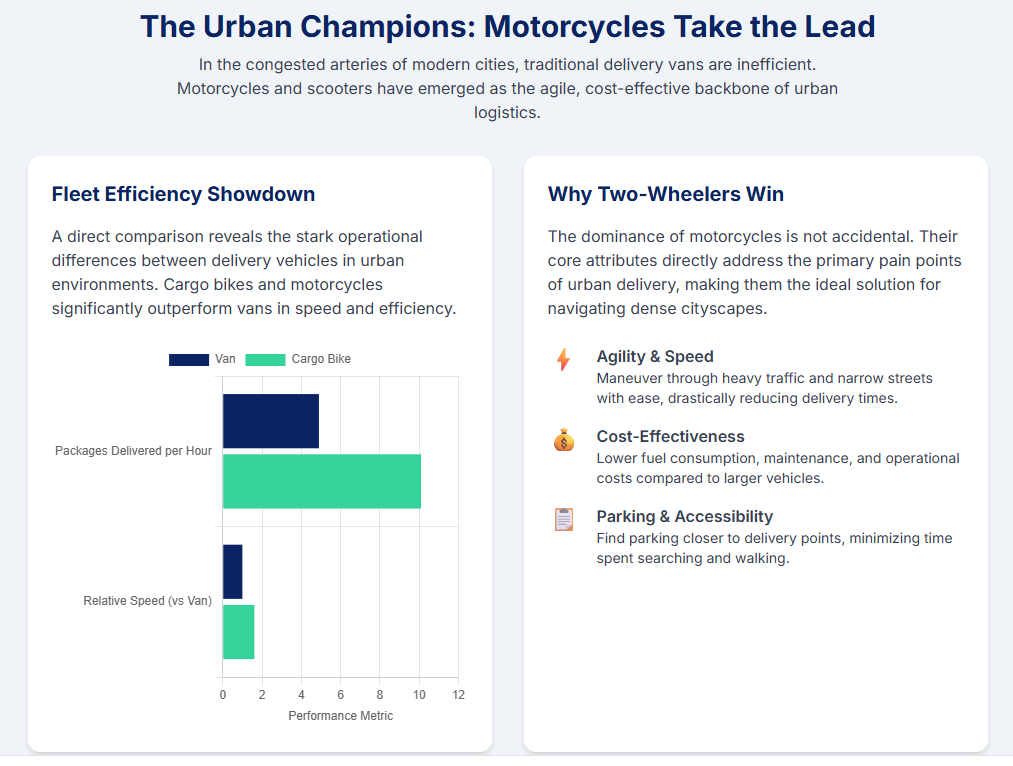
The core reasons for this dominance are rooted in their inherent design and operational characteristics. Motorcycles and scooters thrive in congested urban environments due to their agility, cost-effectiveness, and ability to maneuver through heavy traffic.6 Their superior speed and maneuverability make them ideal for the shifting consumer behavior towards same-day and next-day delivery, which has become a standard expectation.6 This trend has compelled logistics providers to adopt motorcycles as a core part of their fleet. Within this segment, scooters, in particular, lead the market due to their unique attributes that align perfectly with the demands of urban delivery operations, including superior maneuverability, low operating costs, and practical storage space.6
2.2. A Comparative Analysis: The Performance, Cost, and Environmental Impact of Competing Fleets
While vans have been the traditional workhorse for last-mile delivery, they are proving to be increasingly inefficient in urban settings. Vans struggle to navigate narrow and crowded city streets, and drivers can spend hours on the road each week simply trying to park, turn around, and back out of tight spaces.11 This inefficiency leads to a larger carbon footprint and increased time-to-delivery.11
Conversely, alternative delivery methods like cargo bikes are emerging as a highly effective, low-carbon solution. A study in central London found that cargo bikes were, on average, 1.61 times faster than vans.12 A separate study highlighted that electric cargo bikes are twice as efficient and over ten times cheaper to operate than vans in urban areas.13 Cargo bikes can use shorter routes, find parking much faster and closer to the recipient, and deliver more packages per hour (an average of 10.1 packages per hour compared to 4.9 for a van).13 Their environmental impact is also drastically lower, with an estimated 98% reduction in greenhouse gas emissions compared to a diesel van.13
The evidence points to the need for a specialized, multimodal last-mile delivery ecosystem where each vehicle type has a distinct, optimized role. The fact that cargo bikes are proving to be extremely fast for certain tasks, while motorcycles remain the “backbone” of urban logistics, is not a contradiction. The cargo bike’s advantages are most pronounced in ultra-dense, inner-city zones for small-parcel delivery.13 Motorcycles, meanwhile, fill a gap between electric cargo bikes and electric vans in a wider range of geographical areas, including cities, suburban, and rural areas.15 This indicates that the motorcycle is the all-purpose, versatile generalist, suitable for a wider range of payloads and distances, while the cargo bike is the specialist for hyperlocal, high-density deliveries. This points to a strategic imperative for companies to build hybrid fleets that leverage the specific strengths of each vehicle to optimize efficiency and sustainability.
| Metric | Vans | Motorcycles / Scooters | Cargo Bikes |
| Speed / Time | Slower in congested urban areas; high time spent on parking and maneuvering.11 Van routes can take over 2x longer than cargo bikes.13 | Agile and fast in congested urban environments due to maneuverability.6 | On average, 1.61x faster than vans in central London.12 Deliver 2x as many packages per hour than vans.13 |
| Operational Costs | High due to fuel, maintenance, and labor costs.10 Up to 10x higher expenses per parcel compared to cargo bikes.13 | Low-operating cost.6 Fuel, wages, and maintenance add up.9 | Up to 10x cheaper to operate than a delivery van.13 Lower maintenance and energy costs.13 |
| Environmental Impact | High carbon emissions; contribute to traffic congestion and air pollution.9 | Fuel-efficient compared to vans but still contribute to emissions.17 Transitioning to EVs is a key trend.6 | Emit 98% less CO$_{2}$ per km than diesel vans.13 Zero operational emissions for pedal-only models.14 |
| Maneuverability | Struggle to navigate narrow city streets and find parking; occupy significant road space when parked.11 | Highly maneuverable in traffic; can navigate congested areas with ease.6 | Excellent in urban settings; can use bike infrastructure, and park much closer to recipients.13 |
| Payload Capacity | High; suitable for large, bulky items.16 | Limited; suitable for small parcels, food, and groceries.17 Scooters offer practical storage.6 | Limited for traditional models, but specialized models can transport up to 300kg.14 |
3. The Electric Revolution: Innovations Paving the Way for Sustainable Delivery
3.1. Drivers of Electrification: Sustainability Goals and Operational Benefits
The integration of electric vehicles (EVs) into last-mile delivery is a critical trend driven by both environmental mandates and operational advantages.3 Companies are increasingly prioritizing the adoption of clean technologies to reduce their carbon footprint and align with global sustainability goals.3 This is not merely a matter of corporate responsibility but also a response to evolving consumer preferences for eco-friendly practices, which can enhance brand reputation and consumer loyalty.8
Beyond the environmental benefits, EVs offer significant operational advantages. They produce zero tailpipe emissions, which contributes to improved air quality in urban areas, and they have approximately 90% fewer moving parts than internal combustion engine (ICE) vehicles, which translates to lower maintenance costs.19 The use of EVs also helps companies avoid the volatility of fossil fuel prices, making operational costs more predictable and stable in the long run.19
3.2. Overcoming Hurdles: The Challenges of EV Adoption in Delivery Fleets
Despite the clear benefits, the transition to EVs is not without significant challenges, particularly for fleet managers. The primary hurdles include high upfront investment costs, as electric trucks and two-wheelers are still more expensive than their gasoline counterparts.21 This can pose a substantial financial barrier, especially for smaller businesses and independent contractors. Another major issue is the lack of a robust charging infrastructure 22, compounded by long recharge waiting times that can disrupt delivery schedules and increase a driver’s time on the road.18 The limited driving range and reduced payload capacity of current EV batteries also pose a constraint for companies needing to transport heavy shipments over long distances.18
3.3. Game-Changing Solutions: The Promise of Battery Swapping Networks
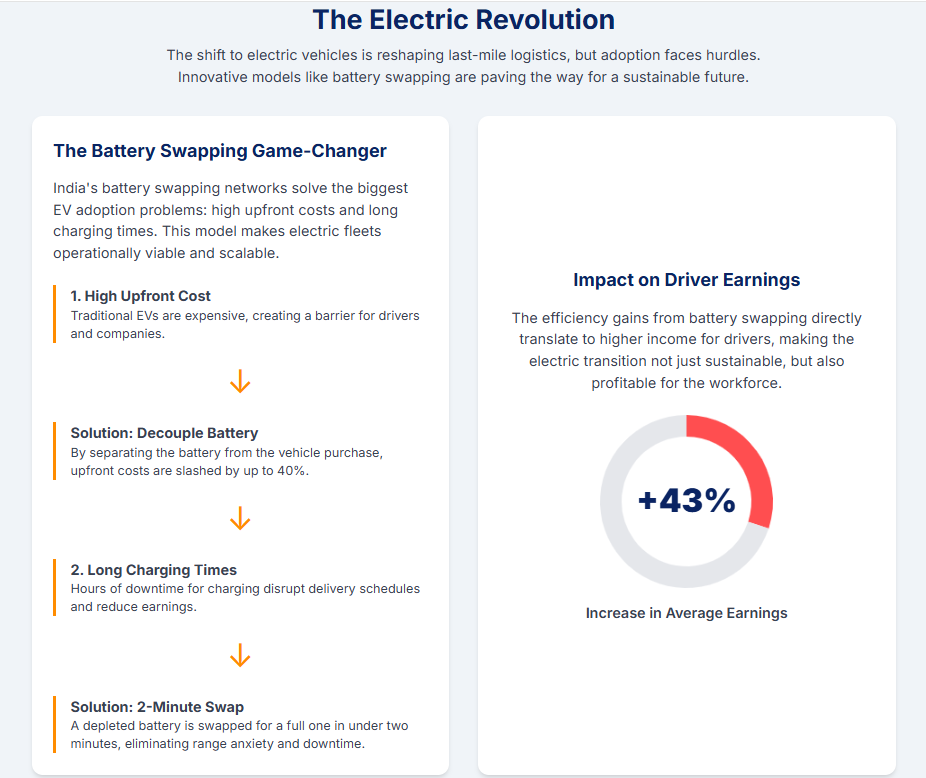
The widespread adoption of EVs for last-mile delivery requires a fundamental shift in infrastructure and business models, moving beyond a simple vehicle replacement. India’s burgeoning battery swapping model is a prime example of this strategic evolution, as it directly addresses the most significant challenges of EV adoption. By decoupling the battery from the vehicle purchase, this model drastically cuts the upfront cost for a driver by up to 40%.23
The most compelling advantage, however, is the elimination of range anxiety and long charging times. A depleted battery can be swapped for a fully charged one in “just 2 minutes,” a process that is even faster than refueling a gas-powered vehicle.23 This innovation makes EVs economically viable and operationally scalable, especially in high-density urban environments and emerging markets. The solution is not just a better battery, but a new, more efficient ecosystem for power delivery that fundamentally changes the total cost of ownership and operational efficiency. One of India’s largest battery-swapping networks operates over 630 stations in 19 cities and performs approximately one million swaps per month.24 This model allows drivers to enjoy “infinite range with infinite swaps” and has been shown to increase average earnings by 43% compared to traditional charging methods.23
4. The Human Factor: Socio-economic and Safety Realities for Delivery Riders
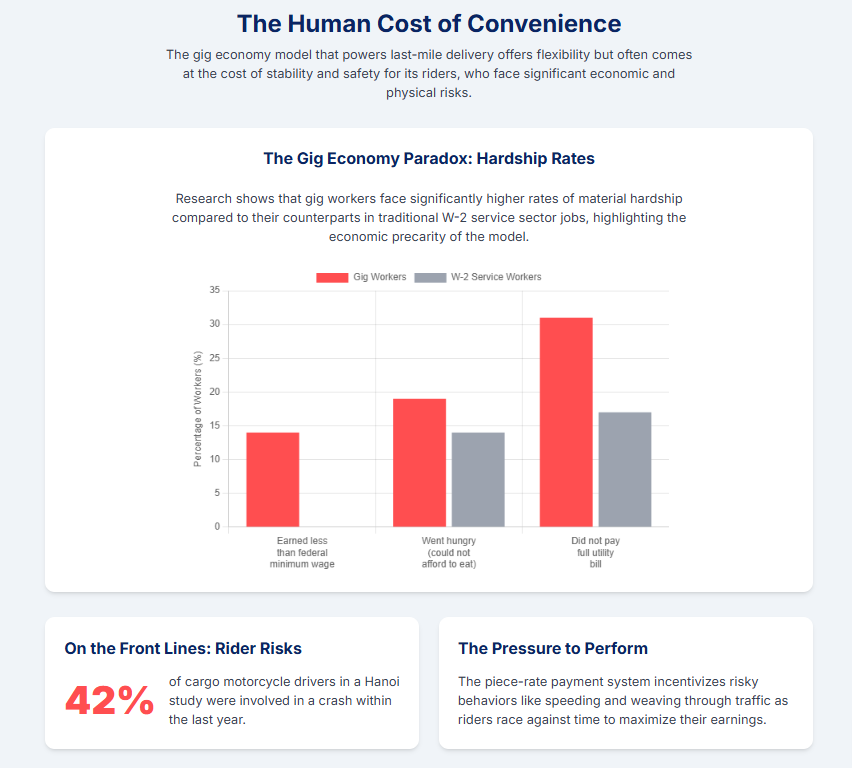
4.1. The Gig Economy’s Paradox: Flexibility, Precariousness, and Income Instability
The gig economy, which underpins much of the last-mile delivery industry, presents a complex reality for its workers. While the model is often lauded for offering flexibility and freedom to set one’s own schedule, it is often a necessity for many who have “no other option” for employment.25 The flexibility is frequently an illusion, as companies classify workers as independent contractors to cut costs on payroll taxes, benefits, and labor compliance.25 This pay structure, often based on a piece rate and incentives, forces drivers to work long hours to earn a decent income, with nearly half of full-time drivers working more than 12 hours a day and some even exceeding 15 hours.27
The lack of a steady salary and employment benefits such as health insurance, retirement plans, and paid leave creates a cycle of income and economic instability.25 Research indicates that many gig workers earn less than the federal or state minimum wage, and a significant portion face material hardships, such as food insecurity and the inability to pay utility bills, at a much higher rate than their W-2 service-sector counterparts.26 The gig model externalizes all risk—from vehicle maintenance to health issues—onto the most vulnerable part of the supply chain: the individual driver.
| Metric | Gig Workers | W-2 Service-Sector Workers |
| Earned less than federal minimum wage | 14% 26 | 0% 26 |
| Earned less than state minimum wage | 29% 26 | Less than 29% (Implied) 26 |
| Went hungry (could not afford to eat) | 19% 26 | 14% 26 |
| Did not pay full utility bill | 31% 26 | 17% 26 |
| Lost earnings due to technical difficulties | 62% 26 | 19% 26 |
4.2. On the Front Lines: A Deep Dive into Rider Safety and Operational Risks
Beyond economic precarity, delivery riders face significant physical risks. Studies in Vietnam and South Africa highlight the heightened risks of violence, hijackings, and road accidents.17 A survey of 726 cargo motorcycle drivers in Hanoi, Vietnam, found that 42.01% had been in a crash in the last year, with 13.37% involved in at least one major traffic crash.28
These risks are a consequence of systemic factors inherent to the nature of the work. The pressure to deliver on a just-in-time schedule to earn a living wage compels riders to engage in unsafe driving behavior, such as weaving through traffic, ignoring speed limits, and using illegal shortcuts.28 Additionally, many drivers lack basic safety gear, such as certified helmets and high-visibility vests, and may operate poorly maintained vehicles.17 Operational inefficiencies, such as working overtime and a lack of rest stops, contribute to a higher risk of both minor and major crashes.28 The constant need to interact with a mobile application for real-time updates and navigation is also a significant distraction, further increasing the risk of accidents.28
4.3. Case in Point: An Analysis of Driver Conditions in Emerging Markets
The challenges faced by gig economy riders are particularly acute in emerging markets, where rapid growth has outpaced regulatory oversight. The rise of e-commerce in South Africa, for example, has increased reliance on motorcycle delivery but has also exposed drivers to a lack of “worker protections” and “precarious working conditions”.17 Similarly, in India, studies on platforms like Swiggy and Zomato highlight the lack of a formal contract and the piece-rate wage system, which incentivizes working long, exhausting hours.27 The lack of consistent support, such as a 24/7 helpline, can leave drivers vulnerable in times of need.27
5. Regional Case Study: India’s Last-Mile Delivery Ecosystem, with a Focus on Pune
5.1. India’s E-commerce and Logistics Surge: A Macro-Economic Perspective
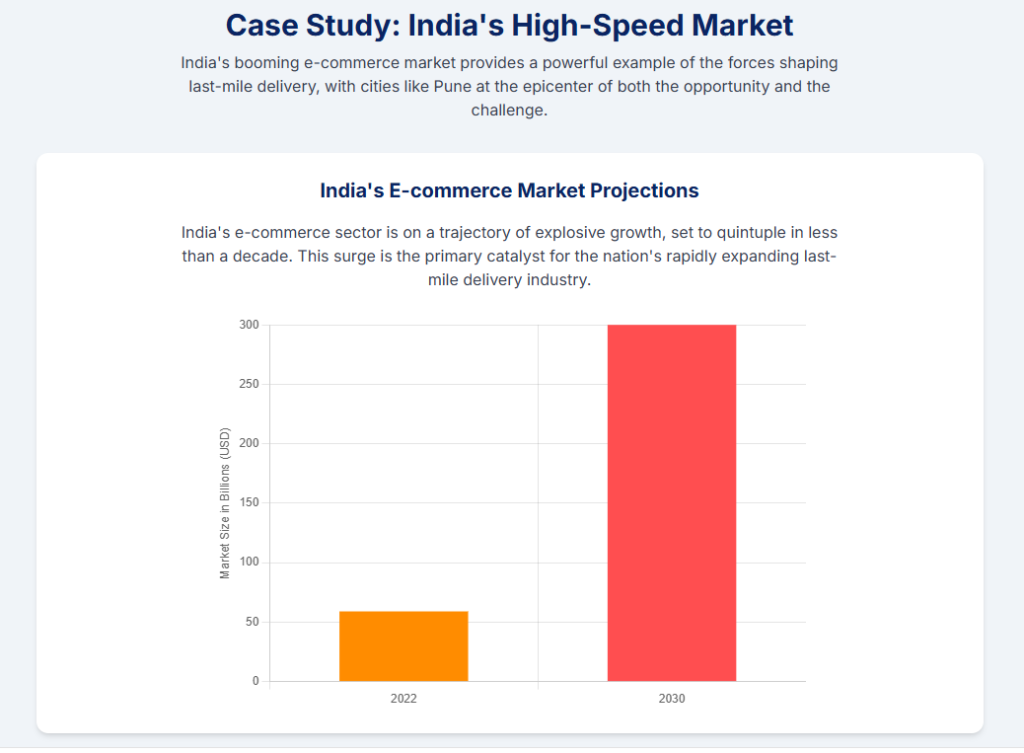
India’s e-commerce market is a powerhouse of growth, expected to surge from USD 59 billion in 2022 to USD 300 billion by 2030, with a remarkable CAGR of 23%.5 This expansion is the primary catalyst for the country’s last-mile delivery market, which is projected to grow from USD 6.50 billion in 2024 to USD 24.00 billion by 2033, exhibiting a CAGR of 13.70%.4 This exponential growth is fueled by rising urbanization, increasing smartphone penetration, and the emergence of hyperlocal models that offer delivery commitments as low as 10-to-30 minutes for food and groceries.7 The following table provides a granular overview of this high-growth market.
| Report Attribute | Credence Research 30 | Grand View Research 32 | IMARC Group 4 | Indian Chamber of Commerce 5 |
| Market | India Last Mile Delivery | India Last Mile Delivery | India Last Mile Delivery | India E-commerce Market |
| Base Year | 2024 | 2023 | 2024 | 2022 |
| Historic Year | 2020-2023 | 2018-2022 | 2019-2024 | N/A |
| Forecast Period | 2025-2032 | 2024-2030 | 2025-2033 | N/A |
| Market Size (Projected) | USD 10,552.72 million (2032) | USD 15,051.9 million (2030) | USD 24.00 billion (2033) | USD 300 billion (2030) |
| Growth Rate (CAGR) | 12.93% | 13.4% | 13.70% | 23% |
| Current Market Size | USD 3533.56 million (2024) | USD 6,243.9 million (2023) | USD 6.50 billion (2024) | USD 59 billion (2022) |
5.2. The Pune Paradox: A Tier-1 City at the Forefront of Urban Logistics
Pune, as a Tier-1 city, is a microcosm of India’s last-mile delivery boom.33 Its robust e-commerce and retail sectors make it a critical logistics hub, as the speed, accuracy, and reliability of deliveries directly impact customer satisfaction and brand loyalty.7 However, Pune also embodies the quintessential “last-mile problem,” with increased traffic congestion, narrow streets, and unpredictable road conditions complicating the delivery process.7
This dynamic creates a direct causal link between urbanization challenges and the rising demand for motorcycles. The research confirms that to overcome these specific urban challenges, “many companies have adopted two-wheelers and bicycles for last mile deliveries, especially in densely populated areas”.7 Motorcycles are uniquely suited to navigate Pune’s dense and complex urban fabric, making them an indispensable component of the local last-mile delivery ecosystem.
5.3. Key Players and Local Trends: The Competitive Landscape and Innovation Drivers
The market in Pune is intensely competitive, with a mix of global and domestic players vying for dominance. Key players include international logistics giants like DHL and FedEx, as well as domestic powerhouses such as Delhivery, Ecom Express, and Ekart.34 These companies are competing fiercely by investing in advanced technology, sustainability initiatives, and network expansion.30
Local trends in Pune mirror the broader national landscape, with a strong emphasis on technology. Companies leverage AI-powered route optimization, real-time tracking, and data analytics to streamline operations, reduce costs, and enhance customer satisfaction.7 The local ecosystem is mature and specialized, supported by a network of motorcycle delivery box manufacturers 35, which indicates a robust supply chain built to support the high-frequency demands of last-mile logistics in the city.
5.4. The Impact of Electrification and Policy on the Local Ecosystem
India is a global leader in two-wheeler electrification, a trend that is directly impacting the logistics sector in Pune. Large companies like Flipkart have committed to a fleet of over 10,000 EVs, demonstrating a clear strategic shift towards sustainable logistics.30 The growth of battery-swapping networks is a critical enabler in this transition, addressing the local-specific challenges of charging infrastructure and enabling the widespread adoption of electric two-wheelers.23
The growth of last-mile logistics is not solely a private-sector initiative. Strategic public-private partnerships are a significant force multiplier, extending reach and increasing efficiency. Amazon’s collaboration with Indian Railways to improve the logistics of e-commerce by utilizing railway infrastructure for quicker package movement is a powerful example of this.4 This type of collaboration demonstrates that last-mile delivery is being integrated into a broader, national logistics framework. The government’s investments in intelligent traffic management systems and the railway’s infrastructure upgrades directly support and accelerate the private sector’s ability to provide efficient last-mile services. This symbiotic relationship shows how public policy and infrastructure development can directly fuel the growth of the private last-mile delivery ecosystem, setting the stage for a sustainable and scalable future.
6. Strategic Outlook and Actionable Recommendations
6.1. Future Trajectories: Projections and Emerging Trends
The last-mile delivery market is poised for continued rapid expansion, driven by urbanization and unwavering consumer demand. The distinction between food, parcel, and hyperlocal delivery will likely blur, leading to more integrated and versatile delivery models.30 The normalization of same-day and even same-hour delivery will place increasing pressure on operational efficiency and vehicle performance.3
Technologically, AI, machine learning, and big data will become indispensable for route optimization, demand forecasting, and predictive analytics.3 The move towards hybrid fleets combining vans, motorcycles, and cargo bikes will become a standard strategic approach for major players, as it allows for the optimization of vehicle type based on delivery density, package size, and route characteristics.3 While the rise of autonomous last-mile delivery, including drones and robots, is a future trend with a projected CAGR of 23.1% 36, non-autonomous vehicles will remain dominant in the near term.1
6.2. Strategic Imperatives for Logistics and E-commerce Companies
To thrive in this dynamic landscape, companies must adopt a multi-faceted strategic approach. First, they must move beyond a single-vehicle strategy and adopt a multimodal fleet model that leverages the specific strengths of each vehicle type to maximize efficiency and cost-effectiveness.15 Second, the transition to electrification is a necessity, but the focus must extend beyond simply acquiring EVs to investing in or partnering with supporting infrastructure, particularly battery swapping networks, to overcome cost and charging hurdles.23 Finally, companies must prioritize the human element. While technological solutions are critical, a focus on rider welfare is a moral and strategic imperative. This includes providing a fair wage structure, ensuring access to benefits, and implementing comprehensive safety training to mitigate risk and ensure long-term brand sustainability.17
6.3. Policy Recommendations for Sustainable and Equitable Urban Logistics
Policymakers have a critical role to play in shaping a sustainable and equitable last-mile delivery ecosystem. First, they should facilitate the transition to EVs by offering financial incentives and investing in a unified charging and swapping infrastructure.21 Second, regulations should be developed to formalize labor protections for gig workers, ensuring they have access to a minimum wage, health insurance, and accident-related support to address the inherent economic precarity of the model.25 Finally, urban planning must adapt to the new reality of last-mile delivery by creating dedicated infrastructure, such as bike lanes and micro-fulfillment hubs, to reduce congestion and improve efficiency for all road users.3
6.4. Concluding Synthesis
The last-mile delivery market is a complex nexus of technological innovation, consumer demand, and socio-economic dynamics. The motorcycle’s role is not a passing trend but a strategic, agile solution for a global, urbanizing world. The future of this industry depends on the ability of businesses and policymakers to holistically address its inherent challenges—from logistical inefficiencies and environmental concerns to the human cost of a new economic model—to create a system that is not only fast and profitable but also sustainable and equitable. The symbiotic relationship between technological advancement, supportive public policy, and a commitment to worker welfare will be the defining factor in determining which companies and regions lead this next phase of global commerce.
Sources
- Last Mile Delivery Market Size, Share & Growth Report, 2030 – Grand View Research, accessed on August 28, 2025, https://www.grandviewresearch.com/industry-analysis/last-mile-delivery-market-report
- Key Drivers for Last Mile in E-commerce Delivery Market Growth: Projections 2025-2033, accessed on August 28, 2025, https://www.datainsightsmarket.com/reports/last-mile-in-e-commerce-delivery-1967841
- Future Of Last-Mile Delivery And Trends For 2025 – Dropoff, accessed on August 28, 2025, https://www.dropoff.com/blog/future-of-last-mile-delivery-and-trends/
- India Last Mile Delivery Market Size, Share & Report 2033, accessed on August 28, 2025, https://www.imarcgroup.com/india-last-mile-delivery-market
- Impact of E-Commerce on Modern Logistics Solutions, accessed on August 28, 2025, https://blogs.indianchamber.org/business-industry/impact-of-e-commerce-on-modern-logistics-solutions/
- Last Mile Delivery Motorcycles Market Outlook (2021-2031) – Business Market Insights, accessed on August 28, 2025, https://www.businessmarketinsights.com/reports/last-mile-delivery-motorcycles-market
- Last Mile Delivery Services in Pune. – Patliputra Logistics, accessed on August 28, 2025, https://patliputralogistics.com/last-mile-delivery-services-in-pune/
- Last Mile Delivery Management: Strategies for Success – TVS SCS, accessed on August 28, 2025, https://www.tvsscs.com/last-mile-delivery-management-strategies-for-success/
- 16 Last-Mile Delivery Challenges and How to Overcome Them – Locate2u, accessed on August 28, 2025, https://www.locate2u.com/last-mile-delivery/last-mile-delivery-challenges/
- Last mile (transportation) – Wikipedia, accessed on August 28, 2025, https://en.wikipedia.org/wiki/Last_mile_(transportation)
- Ford Case Study: Last Mile Delivery – Valtech, accessed on August 28, 2025, https://www.valtech.com/work/ford-last-mile-delivery/
- Cargo bike delivery is much faster than polluting vans and trucks …, accessed on August 28, 2025, https://momentummag.com/cargo-bikes-can-deliver-faster-than-vans-while-providing-massive-benefits/
- Electric Cargo Bikes Are 2X Efficient & 10X Cheaper Than A …, accessed on August 28, 2025, https://cleantechnica.com/2024/01/24/electric-cargo-bikes-are-2x-efficient-10x-cheaper-than-a-delivery-van-study-finds/
- Do Cargo Bicycles Reduce Emissions in Urban Logistics? – HOVSCO, accessed on August 28, 2025, https://www.hovsco.com/blogs/cargo-utility-e-bikes/do-cargo-bicycles-reduce-emissions-in-urban-logistics
- Last-Mile Delivery Through Electric Motorbikes: Modelling Considerations for Parcel vs. Food Delivery – ResearchGate, accessed on August 28, 2025, https://www.researchgate.net/publication/394774729_Last-Mile_Delivery_Through_Electric_Motorbikes_Modelling_Considerations_for_Parcel_vs_Food_Delivery
- Analysis of Modern vs. Conventional Development Technologies in Transportation—The Case Study of a Last-Mile Delivery Process, accessed on August 28, 2025, https://pmc.ncbi.nlm.nih.gov/articles/PMC9784186/
- E-commerce at the last-mile: Media narratives on safety and working conditions of motorcycle delivery drivers – ResearchGate, accessed on August 28, 2025, https://www.researchgate.net/publication/392592805_E-commerce_at_the_last-mile_Media_narratives_on_safety_and_working_conditions_of_motorcycle_delivery_drivers
- Electric Vehicles in Last-Mile Delivery: A Bibliometric Review – MDPI, accessed on August 28, 2025, https://www.mdpi.com/2032-6653/16/1/52
- How Electric Vehicles – Game Changer for Last Mile Delivery – FarEye, accessed on August 28, 2025, https://fareye.com/resources/blogs/electric-vehicles-for-last-mile-delivery
- Are Electric Vehicles Solving the Last Mile Challenge? – Viva Technology, accessed on August 28, 2025, https://vivatechnology.com/news/are-electric-vehicles-solving-the-last-mile-challenge
- Jolts on the Journey to EV Fleet Adoption: 5 Hidden Challenges and Solutions, accessed on August 28, 2025, https://happyeconews.com/jolts-on-the-journey-to-ev-fleet-adoption-5-hidden-challenges-and-solutions/
- EV vehicle adoption and challenges for fleets – Mastercard, accessed on August 28, 2025, https://www.mastercard.com/us/en/news-and-trends/Insights/2025/ev-fleet-report.html
- India’s Largest Battery-Swapping Network for Electric Vehicles, accessed on August 28, 2025, https://www.batterysmart.in/
- In India, battery swapping fuels electric market for 2 and 3 wheels – Cipher News, accessed on August 28, 2025, https://www.ciphernews.com/articles/in-india-battery-swapping-fuels-electric-market-for-2-and-3-wheels/
- What Are The Economic Implications Of The Rise Of … – IOSR Journal, accessed on August 28, 2025, https://www.iosrjournals.org/iosr-jbm/papers/Vol26-issue10/Ser-7/A2610070113.pdf
- National survey of gig workers paints a picture of poor working conditions, low pay, accessed on August 28, 2025, https://www.epi.org/publication/gig-worker-survey/
- Understanding Food Delivery Platform: Delivery Persons‟ Perspective – TISS, accessed on August 28, 2025, https://tiss.ac.in/uploads/files/Online_Food_Delivery_Platform.pdf
- (PDF) Ensuring traffic safety of cargo motorcycle drivers in last-mile …, accessed on August 28, 2025, https://www.researchgate.net/publication/362010729_Ensuring_traffic_safety_of_cargo_motorcycle_drivers_in_last-mile_delivery_services_in_major_Vietnamese_cities
- Motorcycle Delivery Safety, accessed on August 28, 2025, https://www.roadsafetyuae.com/motorcycle-delivery-safety/
- India Last Mile Delivery Market Size, Growth and Forecast 2032 – Credence Research, accessed on August 28, 2025, https://www.credenceresearch.com/report/india-last-mile-delivery-market
- Analyzing The Indian E-Commerce Logistics Market – GLG, accessed on August 28, 2025, https://glginsights.com/articles/analyzing-the-indian-e-commerce-logistics-market/
- India Last Mile Delivery Market Size & Outlook, 2023-2030 – Grand View Research, accessed on August 28, 2025, https://www.grandviewresearch.com/horizon/outlook/last-mile-delivery-market/india
- Pune Industrial & Logistics Market Watch – Savills, accessed on August 28, 2025, https://pdf.savills.asia/asia-pacific-research/india-research/pune-industrial-logistics-market-watch-year-end-2024.pdf
- Top 10 Last-Mile Delivery Services In Pune – Navata SCS, accessed on August 28, 2025, https://navatascs.com/top-10-last-mile-delivery-services-in-pune/
- Top Motorcycle Delivery Box Manufacturers in Pune near me – Justdial, accessed on August 28, 2025, https://www.justdial.com/Pune/Motorcycle-Delivery-Box-Manufacturers/nct-12221142
- Autonomous Last Mile Delivery Market Size, Share – 2033, accessed on August 28, 2025, https://www.alliedmarketresearch.com/autonomous-last-mile-delivery-market
Our Social Media Handles
- Instagram : LivingWithGravity
- Medium : Akash Dolas
- YouTube Channel : Gear and Shutter


