


?")


The Electrification of African Mobility: A Strategic Analysis of the Battery-as-a-Service Model
I. Executive Summary: The African E-Mobility Revolution
The transition to electric mobility in Sub-Saharan Africa (SSA) is not a gradual shift but a rapid, opportunity-driven pivot concentrated overwhelmingly in the two- and three-wheeler transport segment—motorcycle taxis (boda-bodas) and three-wheeled carriers (bajajs/tuk-tuks). The United Nations Environment Programme (UNEP) has recognized the electrification of this segment as the “first priority” for transport decarbonization in the region [1]. This revolution is fundamentally driven by compelling unit economics for the end-user, creating a powerful, bottom-up demand signal that is proving more effective than many top-down policy mandates.
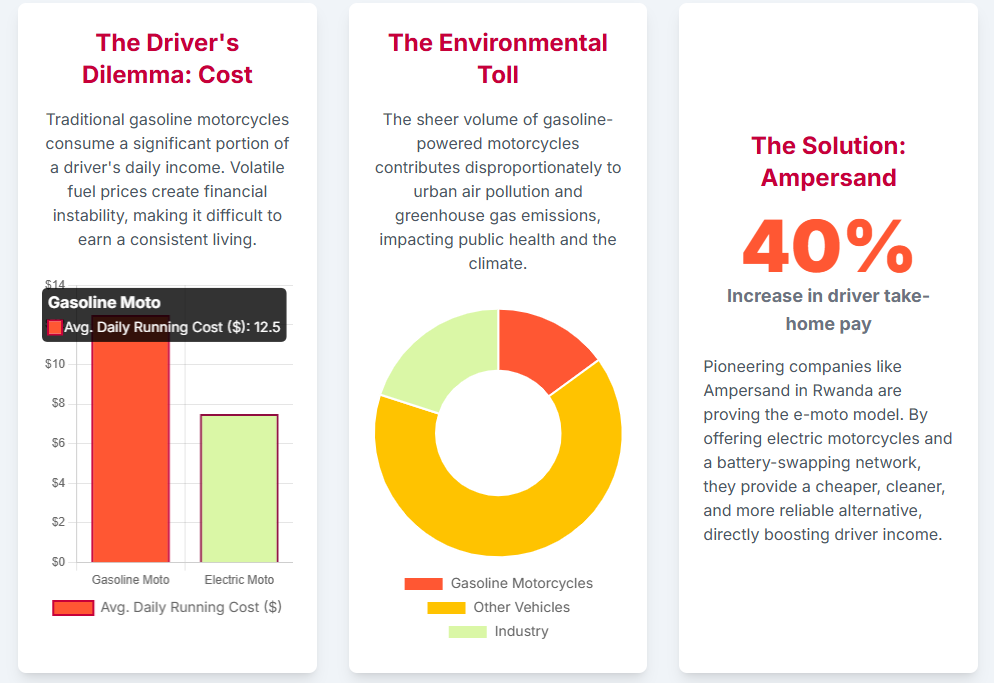
The primary success mechanism leveraged by market leaders, including Ampersand in Rwanda and Spiro across East and West Africa, is the Battery-as-a-Service (BaaS) model. This service-based infrastructure effectively mitigates the two most critical barriers to widespread electric vehicle (EV) adoption in low-income markets: the high upfront cost of battery ownership and range/charging anxiety. By shifting the financial burden of the battery, e-mobility solutions can increase a driver’s take-home pay by 45% or more, transforming what is typically a low-profit, high-risk livelihood into a sustainable income stream [2].
The sector has recently attracted significant institutional capital, validating its scalability. This is evidenced by Spiro’s landmark $100 million investment round, which included funding from the Fund for Export Development in Africa (FEDA), and Ampersand’s successful Series A extension rounds in 2024 [3, 4]. While the environmental benefits are massive—potentially achieving a 98% reduction in greenhouse gas (GHG) emissions when vehicles charge on renewable energy grids [5]—realizing this maximum impact requires concurrent and strategic investment in renewable energy infrastructure to manage potential strain on aging grids [6]. Crucially, governments are recognizing that sustainable growth must shift beyond merely importing finished vehicles to incentivizing local assembly and battery component manufacturing, which is critical for job creation, mitigating import tariffs, and designing vehicles optimized for the unique African context [7, 8].
The electrification of the boda-boda sector represents a critical nexus between global climate mitigation goals (SDG 13), sustainable cities (SDG 11), and immediate poverty reduction (SDG 1) [9]. Since the income generated by an average driver supports 4.6 people in Rwanda and 3.8 people in Kenya, doubling their disposable income directly impacts the livelihoods of four to five individuals per vehicle [2]. This magnitude of immediate economic and social uplift positions the e-moto sector as a prime candidate for impact-first capital, fundamentally altering the investment calculus from purely financial returns to achieving blended returns (financial, social, and environmental). The success realized in the 2- and 3-wheeler segment acts as the indispensable testbed and technical blueprint for electrifying larger fleets, such as paratransit minibuses (matatus) and last-mile delivery vans, by proving the viability and scalability of the BaaS logistics and fleet management software (telematics) in challenging infrastructure environments [9, 10].
II. The E-Moto Market Landscape in Sub-Saharan Africa (SSA)
2.1. The “Boda Belt” and Market Opportunity
The surge in African e-mobility is geographically focused along what is termed the “Boda Belt,” a stretch of countries running from Dar es Salaam, Tanzania, westward toward Dakar, Senegal, characterized by the prominence of motorcycle taxis [3]. This region presents an immense addressable market, as the continent was home to an estimated 27 million two- and three-wheel vehicles as of 2020 [11]. The high frequency of use and reliance on fuel within this critical transport sector translates into an estimated USD 25 Billion annual fuel market, providing a clear indication of the sheer scale of the displacement opportunity for electric solutions [12].
2.2. Competitive Analysis: Market Leaders and Ecosystems
The transformation is being driven by a clutch of specialized startups. Key players in the region include Ampersand, headquartered in Kigali, Rwanda [4], Spiro, which has established itself as a regional leader in electric two-wheelers and battery swapping [3], Zembo in Uganda, and Roam Motors. The movement also encompasses three-wheel electric vehicles, such as TRÍ in Tanzania, where the economic argument is equally strong: covering 20 kilometers with an electric bajaj costs just $0.20, significantly less than the approximately $1.20 required for gasoline, allowing drivers to offset the price difference between electric and conventional vehicles within six to eight months [11].
Ampersand has pursued a strategy of building a fully integrated network from the ground up, encompassing proprietary technology designed explicitly for African drivers. This includes purpose-built e-motos, durable battery packs (including the development of the world’s first production lithium iron phosphate motorbike battery [2]), a network of swap stations, and the proprietary AmperOps fleet management software [2].
2.3. Investor Sentiment and Capital Inflows
Investor confidence in the scalability of the BaaS model is high, evidenced by substantial capital injections. Ampersand successfully secured multiple funding rounds in 2024, including a $7.5 million Conventional Debt round and a $2 million Series A extension in August 2024 [4]. The strongest market validation, however, came with Spiro’s landmark $100 million investment round, which signaled a clear capital benchmark for sector valuation and accelerated scaling ambition. A large portion of this funding came from development finance institutions, emphasizing confidence in Spiro’s mission to provide affordable mobility [3].
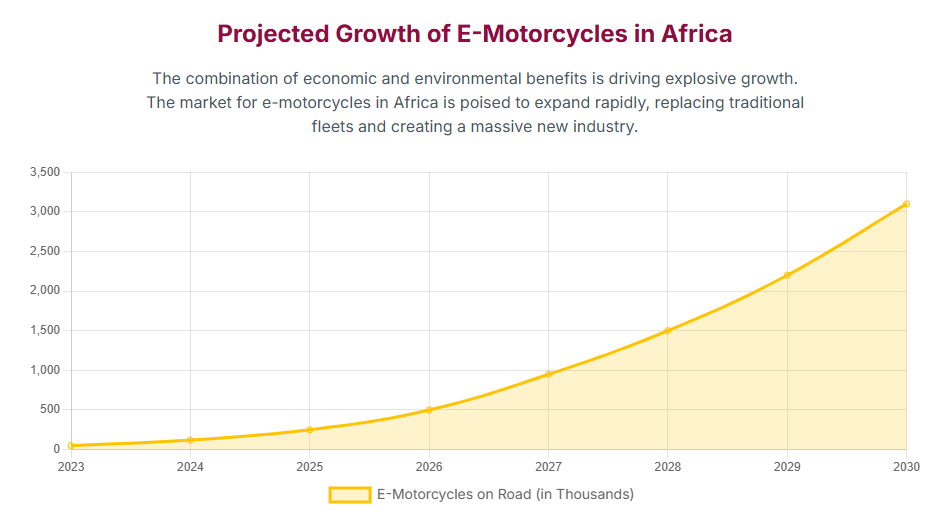
Leading firms are now focused on rapid infrastructure deployment. Ampersand is scaling its manufacturing capabilities, notably opening a 21,000-square-metre manufacturing facility in Kenya in October 2024 [4]. This expansion is aimed at growing the fleet to 13,000 bikes and doubling its battery swap network by early 2026 to meet soaring demand [12, 13]. The high volume of capital flowing into the sector indicates that the primary barrier to entry is no longer market acceptance but the rapid rollout of infrastructure and associated assets.
The shift in financing, moving from typical early-stage venture capital (VC) to large-scale, development-focused financing from institutions like FEDA/Afreximbank, demonstrates that the sector has achieved critical de-risking. The financial need has transitioned from supporting product development to financing large-scale assets, particularly batteries and swap stations, positioning development finance institutions (DFIs) as crucial partners. Furthermore, the geographic expansion strategy employed by leaders like Ampersand—establishing a major manufacturing hub in Kenya [4]—is a tactical move to leverage Kenya’s position as a regional hub for trade into inland East African countries, including Rwanda and Uganda [14]. This hub-and-spoke model optimizes logistics, mitigates cross-border import tariffs, and facilitates efficient distribution into adjacent markets, maximizing regional market access.
III. Ampersand: A Deep Dive into the Battery-as-a-Service (BaaS) Model
3.1. The BaaS Operational and Financial Architecture
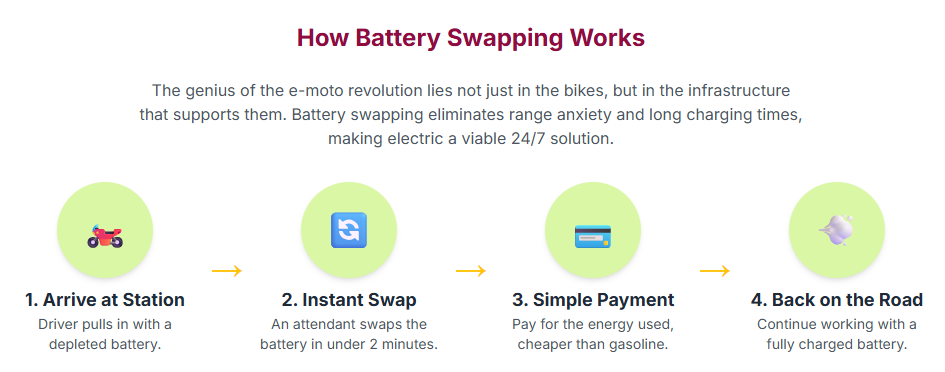
The Battery-as-a-Service (BaaS) model is the foundation of Ampersand’s commercial success. It works by separating the high cost of the battery—which can represent up to 40% of the EV’s price—from the motorcycle itself [13]. This mitigates the single biggest constraint on EV adoption in emerging economies. The operational mechanism involves riders purchasing or leasing the electric bike chassis, then accessing energy through the battery swap network. A depleted battery is exchanged for a fully charged one in minutes, a process significantly faster than traditional charging or liquid fuel refueling [2, 13]. The entire system is managed through a fully integrated network featuring purpose-built electric motorcycles and proprietary fleet management software, ensuring efficient, AI-optimized battery allocation and cost control [2]. Currently, the network powers over 6,000 e-motos and facilitates more than 20,000 battery swaps every day [2, 12].
3.2. Financial Engineering and Bankability
The BaaS architecture generates structural financial advantages that secure capital and increase profitability [13]:
- Lower Upfront Costs: By avoiding the heavy expense of battery ownership, riders can purchase or finance an e-moto at a price comparable to a conventional petrol motorcycle [2].
- Recurring Revenues: Ampersand secures a steady, predictable income stream through energy-as-a-service fees, creating a reliable, utility-like financial profile.
- Bankable Assets: The centralized, managed battery assets and predictable swap system generate a financial profile that is highly attractive to institutional lenders and investors [13].
This structure fundamentally transforms the investment risk profile. By retaining ownership and control of the battery, the company converts a volatile manufacturing/sales model into a stable, sustainable infrastructure fund model. The batteries become centrally managed assets, allowing the company to control battery health, charging quality, and utilization (essential for grid stability and driver safety). Furthermore, ownership ensures a predictable future supply of used batteries for secondary market applications, such as stationary energy storage or recycling, thereby embedding circular economy principles directly into the core business model.
3.3. Scaling Strategy and Infrastructure Requirements
Ampersand’s infrastructure is specifically engineered for African operating conditions, ensuring that the system is reliable, costs less to operate, and outperforms petrol alternatives [2]. The batteries are durable Lithium Iron Phosphate (LFP) types, which are locally assembled in Rwanda [5]. This local assembly of LFP batteries provides a crucial proof point for localized technological control, reducing dependency on complex, capital-intensive foreign assembly and optimizing battery performance for high-temperature African environments. This strategy also enhances supply chain resilience against global shocks and aligns with government goals for local value creation and reduced import tariffs [15]. The immediate strategic objective is to double the existing battery swap network by early 2026 to support the ambitious 13,000-bike fleet target, requiring significant capital expenditure on both station rollout and battery inventory [12].
IV. Quantified Socio-Economic Impact and Driver Economics
4.1. Detailed Cost Comparison: E-Moto vs. Internal Combustion Engine (ICE)
The most compelling driver for e-mobility adoption in SSA is the dramatic financial improvement it offers the motorcycle taxi operator. Conventional drivers often spend over $11 daily on fuel and vehicle leasing costs, leaving them with take-home pay as low as $1.60 per day [2, 5]. E-motos, conversely, cost half as much to power as their petrol counterparts, allowing drivers to increase their take-home pay by 45% [2], translating to significant savings of over $500 USD per year [5].
A comparative study conducted on Zembo drivers in Kampala, Uganda, quantifies this economic transformation [16]. The weekly operating income for Zembo (EV) drivers averaged $49 (± $8) USD, which is a 133% increase compared to the $21 (± $4) USD earned by conventional drivers, representing an average weekly difference of $28 USD [16]. Furthermore, the study noted initial maintenance cost savings for electric bikes at a 90% reduction (estimated at $0.4 USD weekly) compared to petrol bikes. Although this initial figure moderates due to early-stage subsidies and warranties, the long-term estimate is still a projected 55% reduction in maintenance costs compared to similarly aged conventional motorcycles [16].
The following table summarizes the operational cost disparity:
Comparative Operational Economics: E-Moto vs. Petrol Boda-Boda
| Metric | Conventional Petrol Motorcycle (ICE) | Electric Motorcycle (EV – Zembo/Ampersand) | Delta / Savings |
| Average Weekly Fuel/Energy Cost | ~$22.00 USD (Estimated) | ~$15.00 USD [16] | 32% Reduction (~$7.00 USD weekly) |
| Average Weekly Maintenance Cost | ~$4.00 USD (Estimated) | ~$0.40 USD (Initial Estimate) [16] | 90% Reduction (Initial) |
| Estimated Weekly Operating Income | $21 ($\pm$ $4$) USD [16] | $49 ($\pm$ $8$) USD [16] | 133% Increase ($28 USD weekly) |
| Income Increase Percentage | N/A | Up to 45% Increase in Take-Home Pay [2] | Life-Changing Savings [2] |
4.2. Income Enhancement and Poverty Alleviation
The increased income afforded by the switch to electric is categorized as “truly life-changing” [2], particularly because boda costs represent the single biggest expense in a driver’s life [2]. This economic benefit has a profound social multiplier effect: the income supports an average of 4.6 people in Rwanda and 3.8 people in Kenya [2]. The quantified income increase mitigates the inherent business risk associated with the informal transport sector. If a driver’s disposable income rises by $28 per week, their capacity to service debt on a vehicle or battery lease is substantially improved, leading to better loan repayment rates and reduced credit risk for financial institutions funding the fleet compared to the low-margin petrol model [16].
4.3. Social Capital and Formalization
Beyond the financial metrics, the adoption of e-motos is correlated with a significant positive change in the perceived individual well-being and social status of drivers [16]. Drivers commonly report feeling more respected by passengers, peers, friends, and family after switching to an electric motorcycle [16]. This elevation in perceived social status contributes to the legitimization and de-stigmatization of motorcycle taxi driving, an occupation frequently viewed as unruly or dangerous [16]. E-mobility is effectively selling not only transport but also a better quality of life and social standing. This non-financial incentive reinforces the economic savings, leading to greater adherence to the system, higher driver retention, and long-term ecosystem stability for mobility providers.
V. Environmental Footprint and Energy Grid Integration
5.1. Lifecycle Emissions Analysis and Carbon Avoidance
The environmental advantage of e-motos stems from zero tailpipe emissions and a massive reduction in overall lifecycle greenhouse gas (GHG) emissions. Conventional motorcycles, like the ubiquitous Bajaj Boxer, emit approximately three tonnes of GHG per vehicle annually [11, 16]. E-motos offer over a 90% reduction in local air pollutants, including PM2.5, CO, and NO2, providing immediate and significant benefits to urban air quality [16]. Ampersand estimates having already avoided 14,000 tons of carbon dioxide equivalent ($\text{CO}_2\text{e}$) [2]. Global adoption of battery electric motorcycles by 2030 could lead to $11$ billion tons of $\text{CO}_2$ reductions by 2050 [1].
The full climate benefit, however, is heavily dependent on the source of electricity used for charging. When e-motos draw power from a fossil-fuel-powered grid, they still produce a 75% reduction in lifecycle GHG emissions compared to petrol bikes. If charging relies entirely on renewable energy sources, that reduction potential climbs to 98% [5]. A critical nuance, however, is that while overall GHG emissions decrease, integrating estimates for battery production indicates that the lifecycle emissions of Sulphur Oxides ($\text{SO}_\text{x}$) may increase, underscoring the need for strict environmental controls in battery manufacturing and assembly processes [16].
5.2. Regional Grid Intensity Mapping and Mitigation
The ultimate environmental payoff is contingent upon the energy generation mix of the local grid [1, 17]. Kenya provides an almost optimal market, with nearly 90% of its electricity generation derived from renewable sources, including 47% geothermal and 21% hydro [14]. EV adoption in Kenya yields near-maximum environmental returns.
Conversely, some regions present a higher localized carbon content emission (LCCE). The Rwandan grid, for instance, has been noted to generate higher emissions per unit of electricity compared to the Tanzanian and Kenyan grids [18]. Similarly, in South Africa, where 79% of electricity is coal-fired, the environmental benefits of EV adoption are maximized only if the transition coincides with a concerted move toward a cleaner national energy mix [17]. The LCCE disparity between key markets creates a geographical distinction in investment priority for climate capital. For maximum climate impact, development finance should be strategically coupled with renewable power generation investments in higher-LCCE regions, or mobility providers should be required to source power from dedicated, verifiable renewable generation sources integrated directly into their swap stations.
5.3. Grid Strain and Reliability Mitigation
Rapid EV adoption risks placing substantial strain on power grid infrastructure that frequently struggles with reliability, coverage, and insufficient capacity across many African nations [6, 19]. However, the BaaS model inherently aids grid management by centralizing the charging load at dedicated stations, enabling better load balancing than distributed residential charging. Furthermore, the decentralized nature of the battery swap network is perfectly suited for integrating with renewable mini-grids, addressing the challenge of limited electricity access (Africa’s average access rate is only about 43% [20]) and extending e-mobility into underserved regions [21]. Charging stations can act as predictable anchor loads for new renewable mini-grids in peri-urban and rural areas, providing the stability and predictable demand necessary to attract investment into off-grid solutions. Strategies to manage grid strain include the deployment of smart grid technologies and demand-response programs to optimize energy distribution [19].
VI. Policy, Regulation, and Localization Strategy
6.1. Review of Key Regulatory Drivers
Successful EV markets globally and in Africa are dependent on proactive government policies that provide financial incentives [22]. Countries including Rwanda, Kenya, Ghana, and Uganda have established frameworks to encourage growth [23]. Crucially, recent policy developments demonstrate a strategic shift away from simply facilitating imports toward actively incentivizing local manufacturing and assembly as a means to capture greater economic value and generate jobs [7].
6.2. Comparative Policy Incentives for E-Motorcycles
Uganda, for example, has enacted a National E-Mobility Strategy that specifically targets local assembly with strong incentives. These include a 10-year income tax exemption for manufacturers, along with VAT and import duty waivers on the components necessary for local assembly [8, 15]. This approach is designed to encourage investment and curb the importation of fully built internal combustion engine (ICE) motorcycles. However, past policy volatility, such as the reversal of broad import duty waivers in Uganda months after their introduction in 2024, can deter large-scale, long-term foreign direct investment (FDI) [8, 24]. The current strategy attempts to overcome this by linking substantial, long-term tax holidays to fixed capital investment and local job creation targets, signaling a more stable, committed policy environment.
In contrast, South Africa applies high import taxes on EVs (25% compared to 18% for ICE vehicles), which hinders immediate consumer adoption, though incentives for local EV production are projected to arrive in 2026 [25, 26]. Ghana and Nigeria offer VAT and import duty exemptions on EVs and are piloting local assembly for vehicles [23].
6.3. Local Value Chain Development: The Strategic Imperative
The localization of the EV value chain is paramount for long-term economic independence. Homegrown manufacturing reduces reliance on imports, mitigates prohibitive import tariffs (which can reach 34% in South Africa [7]), reduces the final cost of the vehicles, and ensures that e-motos are designed specifically to meet African commercial and road requirements [7].
The most significant strategic challenge is closing the battery value chain gap. Africa holds critical battery minerals, yet the continent remains overwhelmingly a supplier of raw materials [27]. The defining economic opportunity is the transition to becoming a global force in battery manufacturing, transforming the region from a resource exporter to a value-added producer. However, developing competitive battery cell manufacturing facilities is immensely capital-intensive, often requiring specialized technical knowledge and investment exceeding $2 billion per facility [28]. This scale necessitates significant FDI and strong regulatory support.
The competition among nations (Morocco, South Africa, Kenya, Egypt [7, 27]) to become EV manufacturing hubs underscores the crucial role of regional integration. A single African nation rarely generates the market demand necessary to justify a multi-billion dollar battery cell factory. Therefore, regional regulatory harmonization and guaranteed cross-border trade facilitated by the African Continental Free Trade Area (AfCFTA) are essential preconditions for creating the necessary market size to attract full battery cell manufacturing investment and realize the maximal economic benefit [28].
VII. Strategic Recommendations and Future Outlook
The African e-mobility sector presents a high-growth, high-impact investment opportunity driven by strong consumer economics, but future success hinges on addressing critical infrastructure and policy risks.
7.1. Risk Mitigation Strategies for Investors
Investors must adopt a holistic view that links fleet financing with complementary infrastructure development. Investment mandates should explicitly fund grid stabilization initiatives, including the deployment of smart grid technologies and backing decentralized renewable energy projects. This ensures reliable power for swap stations, mitigating the risk posed by unreliable national grids [6, 19]. Financiers should prioritize engagement in countries that demonstrate transparent and stable incentives for local value addition (assembly and manufacturing) over short-lived import waivers. Utilizing political risk mitigation tools and partnering closely with DFIs (such as FEDA) is advisable, as DFI participation often signals deeper government commitment and long-term stability [3]. Capital should be focused on integrated “Energy Tech” companies like Ampersand and Spiro, whose BaaS models and proprietary software create high operational entry barriers and powerful network effects, locking in drivers through demonstrated service reliability and superior economics [2].
7.2. Recommendations for Policy Alignment and Localization
African governments must enforce policies that mandate local refining and value-added processing before the export of critical battery minerals [20]. Furthermore, regional blocs must collaborate to establish “Green Mobility Zones” under the AfCFTA framework. These zones should offer harmonized, long-term tax, and infrastructure incentives (such as guaranteed power supply) to attract anchor investments in battery cell manufacturing. The localization strategy must also be accompanied by dedicated funding for technical skills transfer and vocational training to build local capacity in software engineering, battery management systems, and precision manufacturing, thereby addressing the existing technical expertise gap required for high-tech industrialization [7, 28].
7.3. Forecast of Market Evolution
The electrification of African mobility is projected to follow three distinct phases:
- Phase 1 (Current): Focus on high-frequency, two-wheeled passenger transport (boda-bodas). This phase is largely achieved and serves as the proof-of-concept for the BaaS model.
- Phase 2 (Immediate Future): Rapid extension into high-volume, last-mile delivery, and commercial fleets. Vehicles like the MellowVan in South Africa, which offers 2.4 cubic meters of cargo capacity [10], are excellent candidates for BaaS due to their strict reliance on reliability and cost efficiency.
- Phase 3 (Long-Term): The successful two-wheeler BaaS model provides the operational and financial blueprint for the eventual electrification of larger public transit, specifically the minibus (matatu) sector, which constitutes the true backbone of mobility in SSA [9, 17]. While this transition requires significantly higher capital expenditure, larger battery packs, and stronger underlying grid infrastructure, the resulting economic and environmental payoff will be exponentially greater than that of the two-wheeler segment.
Source
https://www.ampersand.energy/https://www.ifc.org/en/stories/2024/kigali-shift-electric-motorcycles-brings-climate-benefithttps://www.weforum.org/stories/2022/05/electric-motorbikes-rwanda-ampersand/https://www.theigc.org/sites/default/files/2020/08/Sudmant-et-al-2020-policy-brief_v2.pdfhttps://www.mordorintelligence.com/industry-reports/africa-electric-vehicle-market
Our Social Media Handles
- Instagram : LivingWithGravity
- Medium : Akash Dolas
- YouTube Channel : Gear and Shutter
- Facebook : LivingWithGravity


